Recently, I came across a press release issued by UOB almost a year ago. Basically the bank had compiled a report that seeks to understand and provide an archetype to the spending habits of a cosmopolitan woman (both young and not so young) in Singapore, based on UOB data (which I presume is the credit card spending patterns).
Even though this report was published in June last year, I would think that the content would still be very much relevant now.
The report intrigued me, as it reflected some fascinating statistics. I thought I would share some here.
- Women in Singapore contribute more than 40 per cent to Singapore’s GDP. To be honest, I didn’t realise that it would be so high! I do acknowledge that there are a lot of working women out there, including working mums. But the fact that we are able to contribute 40 percent to the nations economy says a lot! (It’s no wonder why Shinzo Abe has been trying to tap into the female labour force to feed the nation economy. Turns out that it can be pretty substantial!)
- Women are now spending 17 per cent faster than men do on UOB cards (based on a year-on year comparison 2014 compared with 2015). A whopping 17 percent increase in just one year? Woah… that’s pretty significant. But I guess it also helped that 2015 was a pretty good year for us economically. I will be quite interested to see if the statistics hold for 2016 as well.
- Recent data shows that women in Singapore are generally spending more on their credit cards, as their incomes increase and priorities change through different life stages. The older we are, the more we spend? It’s understandable in a way because some of us might be saddled with college fees, and as you are older and get married, there’s the mortgage and with kids along the way, sometimes expenditure could be higher.
Anyway, back to the report. Based on the research findings, UOB then further segmented the group into 3 main archetypes, which are provided below:
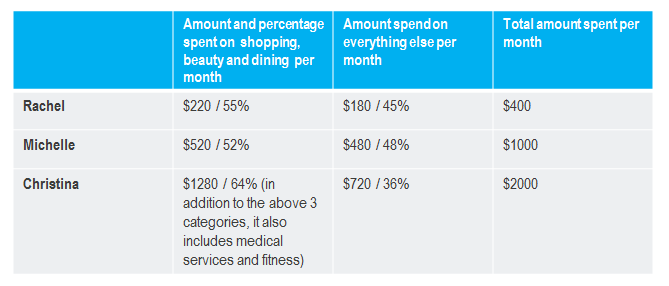
Rachel, the digital native, 18 to 25 years old, spends $400 a month where shopping, beauty and eating make up 55 per cent of her total monthly spend.
Born in the age of the internet, Rachel is technologically-savvy and is typically an early adopter of new digital platforms and solutions, such as paying with her smartphone. Social media is integral for her to stay connected with friends and is a medium for self-expression. Rachel is probably pursuing a tertiary education or is a fresh graduate who has just entered the workforce. As a consumer, she is as comfortable in brick-and-mortar stores as she is online, shopping at least twice a month at e-retailers. Rachel values off-the-beaten track travel and dining experiences. When travelling, she seeks to live as the locals do. She prefers short-term rental stays such as Airbnb to hotels.
Michelle, the young professional, 26 to 35 years old, spends $1,000 a month where shopping, beauty and dining make up 52 per cent of her total monthly spend.
Michelle is well-educated and career-focused. Having worked for a few years, she is likely to be financially independent and interested in long-term investments to build her retirement nest egg. Michelle is often strapped for personal time and values spending her weekends with family and friends. When travelling, she is likely to indulge in the finer things in life, such as dining experiences and luxe fashion brands.
Christina, the cosmopolitan leader, above 36 years old, who spends $2,000 per month where shopping, medical services, beauty and fitness make up 64 per cent of her total monthly spend.
Established in her profession, Christina is a citizen of the world. Travelling often for work, she can find herself in two different cities in a week. As such, maintaining her health and fitness is of utmost importance. When travelling for leisure, she prefers customised holiday experiences over typical agency tours. Financially-savvy and independent, Christina also maintains an investment portfolio.
At first glance, the numbers show that the older we are, the more we spend. I thought I would further refine the chart a little, to track how much women spend in each group collectively, based on the data provided. I would also further assume these are expenditures on credit card.
Taking Christina aside, what is interesting to note is that for Rachel and Michelle, whose spending in terms of percentage stayed relatively consistent (for the same pool of items), the actual amount itself actually ballooned by more than 50%. I don’t suppose I can attribute it entirely to the cost of baby formula milk powder (if grocery shopping does fall into this category as well), as presumably, most ladies in this group might have been married and have young kids. Quoting the report, “When travelling, she is likely to indulge in the finer things in life, such as dining experiences and luxe fashion brands.” To be honest, I do not think this is just exclusive to when travelling. It’s not unusual for women in this group to indulge in a nice brunch with friends over the weekend, or perhaps buy that Gucci bag that they had lusted for the last 3 months, and finally decided to take the plunge to purchase it.
Then again, Michelle is earning her own keep. She can spend the money however she wants.
Yes she can, and she has every right to. But at the same time, I do hope that Michelle is also financially prudent enough to take control of her own money!
A lot of times, we fall trap into the vicious cycle of wanting more, and spending more with increased income. That is not wrong, but that is also based on the presumption that you have a job that will pay the bills.
What if that job ceased to exist?
What if you were suddenly saddled with debt?
Yes, I am making a lot of pessimistic “what ifs” here but are they really that incredulous?
Actually they might be more imminent then we think.